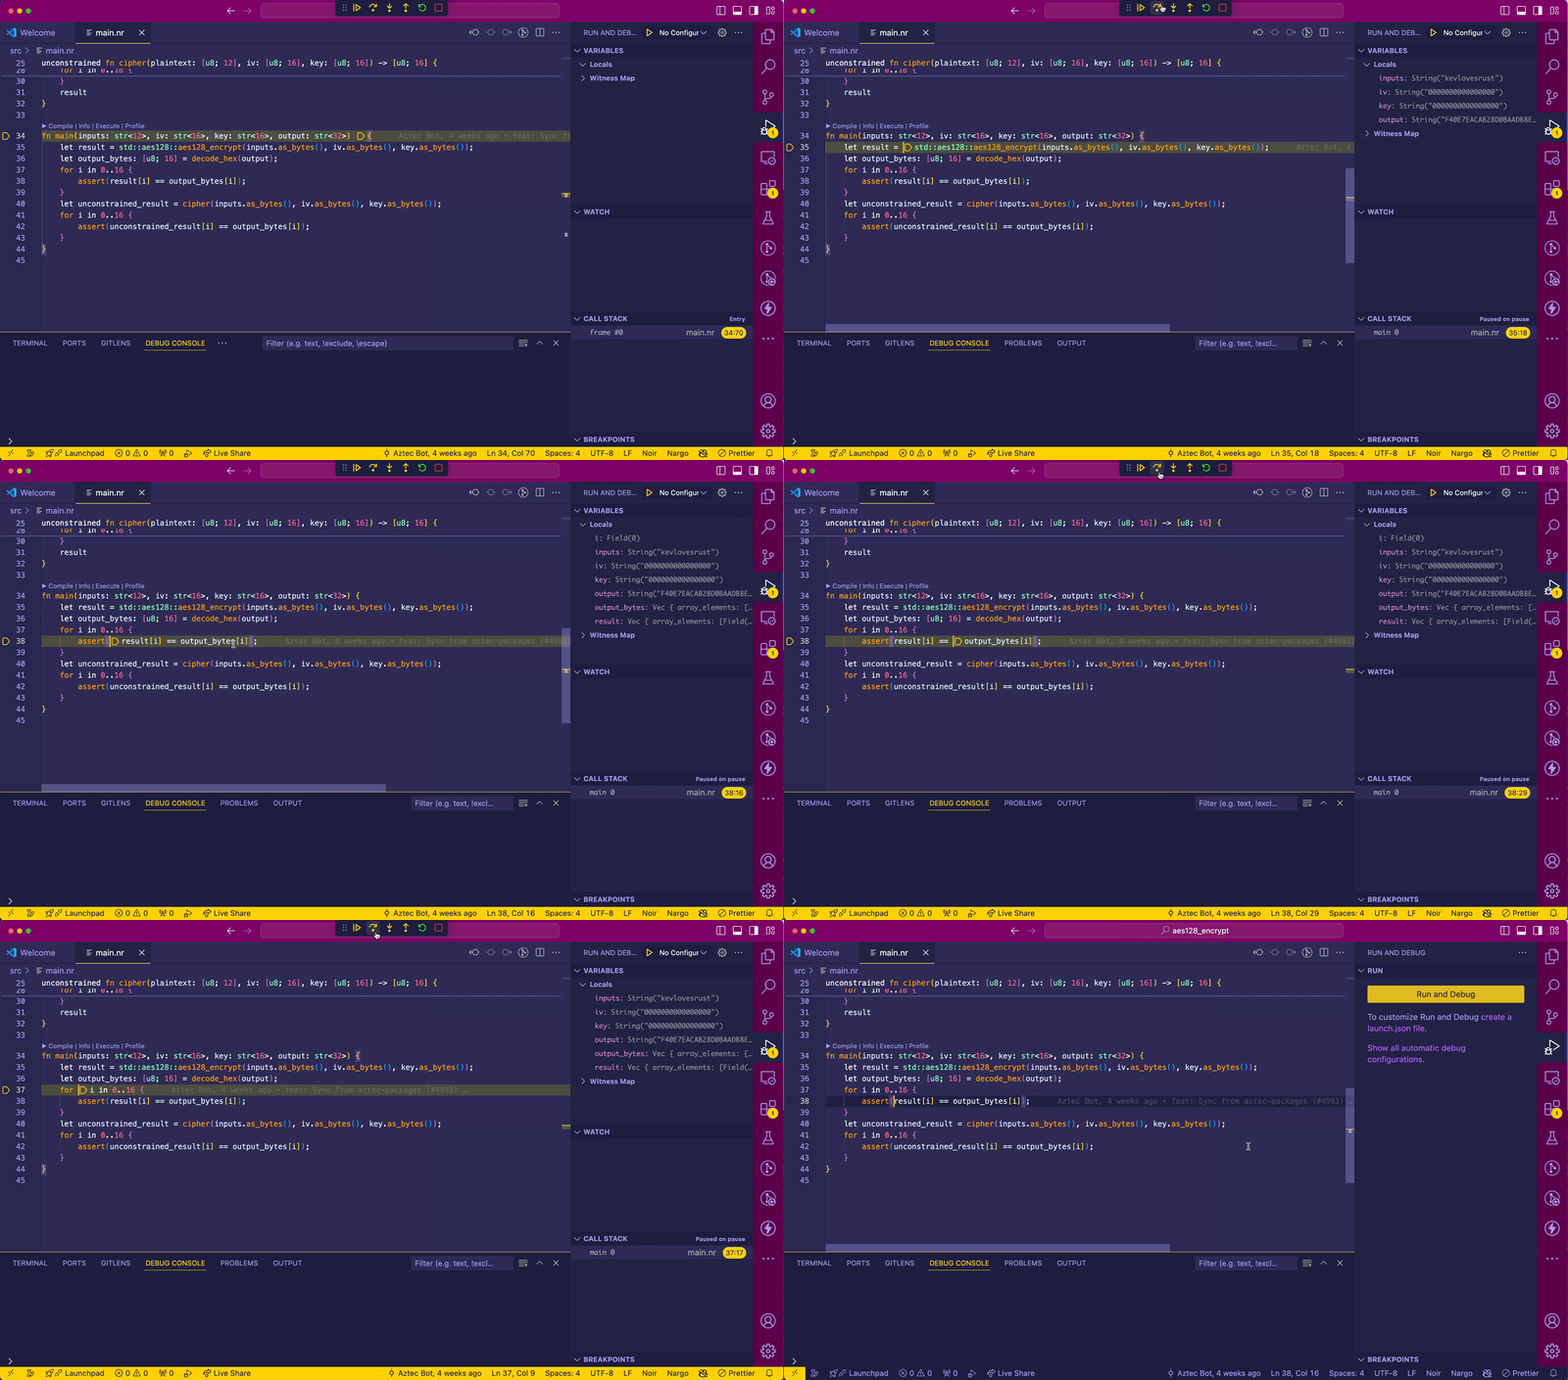
Noir Debugger Released!
What is Noir?
Noir is an open source Domain Specific Language for safe and seamless construction of privacy-preserving Zero-Knowledge programs, developed by Aztec Labs. ZK programs are programs that can generate short proofs of a certain statement without revealing some details about it. You can read more about ZKPs here.
Noir’s design choices are influenced heavily by Rust and it focuses on a simple, familiar syntax.
Noir can be used both in complex cloud-based backends and in users’ smartphones, requiring no knowledge of the underlying math or cryptography. From authorization systems that keep a password in the user’s device, to complex on-chain verification of recursive proofs, Noir is designed to abstract away complexity without any significant overhead.
Why do we want a Noir debugger?
We’ve all been there: we wrote some code, we wrote some tests, ran the tests and… 🚩.
At first sight, the code looks correct, what could be wrong? Time to roll up our sleeves and look harder. Typically we have at least 5 ways of going about this:
- Carefully re-reading the code and “executing” it in our heads.
- Adding a few print statements in key places so we generate an execution trace that we can later inspect.
- Starting a REPL session so we can interact with our code in the terminal.
- Using profilers to analyze dynamic resource usage.
- Starting a debugger session so we can arbitrarily step through the program and inspect its state.
Each of these methods comes with its own strengths and blindspots, so in an ideal world our programming language of choice makes all of them available for us to leverage.
If you’re a Noir programmer, you’re well aware of how focused the Noir team at Aztec Labs is on providing a world class developer experience. That’s why we teamed up with them to build a debugger for Noir, and now we’re thrilled to announce its release! We hope the debugger will enrich the already amazing developer experience of building with Noir.
With this initial release, you can choose whether to debug your Noir programs either from the terminal via a REPL interface, or using Visual Studio Code. Either version of the debugger lets you step through programs, observe program state, work with breakpoints and inspect the assembly code your Noir programs get compiled into.

Getting started
The Noir debugger is available since Noir version 0.27.0. It ships with Nargo, so if your Noir dev environment is more or less up to date, all you need to do to start a debugger session is to run
$ nargo debug
from the root of a Noir project.
If you develop in VS Code, chances are you will want to debug from the editor. To get started, ensure you have the following prerequisites:
- Noir & Nargo > 0.27.0
- Visual Studio Code
- VS Code Noir extension > 0.0.11
Once all the prerequisites are in place, you can visit Noir’s official documentation site to find the debugger’s reference and tutorials.
Under the hood
In case you’re curious about how the debugger works, we wrote a high level overview here. If that leaves you wishing for more geekery, stay tuned since we plan to continue writing about it in the near future!
Come, contribute
We encourage you to add the Noir debugger to your Noir tool belt and help us improve it by requesting features or submitting PRs to the Noir repository. Or, join the conversation on Noir’s tooling Discord channel to share your feedback and connect with other Noir developers.
About Us
At Manas, we build unconventional software. With over 15 years of experience in creating developer tools (including our beloved Crystal programming language), we have a proven track record of delivering high-quality projects across various industries. From PCR data analytics platforms in the medical instruments space, to astronaut helmet firmware in the aerospace industry, to tools for epidemiologists and other humanitarian sector workers, we take pride in designing and developing technology that attends to the needs of its users while furthering business goals.
The Noir debugger is our first sizeable contribution to the ZK space, and it’s certainly not going to be the last ;-)
Do you need help with your next technological challenge? Let’s work together.
